Two Heads Better Than One

These days the notion that cancer cells have picked up genetic alterations (i.e. in their DNA) and that these change the expression of lots of genes is fairly familiar. But what does ‘gene expression’ really mean and how is it controlled? Well, gene expression is the generation of an RNA molecule that carries the same coding information that is enshrined in the sequence of bases in the DNA of that gene — the process of making the RNA is called transcription. The code carried by most RNAs (messenger RNAs — mRNAs) can subsequently be ‘translated’ into the corresponding sequence of amino acids in a protein. And proteins, of course, do all the work to make cells function.

Self-control

And control? There are two levels: 1: the transcription step is regulated to limit the amount of mRNA made from a particular gene. 2: the translation of mRNA into proteins is regulated by post-transcriptional events.

It’s Step 1 that concerns us today in which proteins bind to specific regulatory sequences of DNA in a gene to modulate the activity of the enzyme that makes mRNA molecules from the DNA template. These proteins are generally called transcription factors.

So to be clear: transcription factors are sequence-specific DNA-binding proteins that control the rate of transcription of genetic information from DNA to mRNA — carried out by the enzyme RNA polymerase II. They regulate — turn on or off — genes so that they are expressed in the right cells at the right time. Groups of transcription factors act in a coordinated way to control all cellular processes (growth, division, etc.) and humans have about 1500 of them.

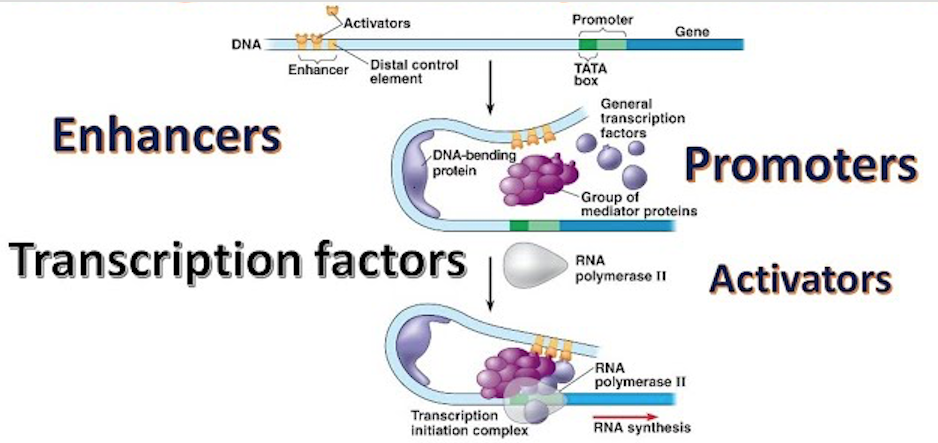
Regulation of gene expression. This scheme shows the concept of regulatory regions within DNA (enhancers and promoters) coming together to control whether a gene is ‘on’ or ‘off’ as a result of transcription factors and mediator proteins binding to specific sequences. When a  gene is turned on RNA is synthesised by the action of RNA polymerase II. A TATA box is a sequence of DNA found in the core promoter region of genes. Other proteins (coactivatorschromatin remodelershistone acetyltransferaseshistone deacetylaseskinases and methylases) also regulate gene expression but as these lack DNA-binding domains they are not transcription factors.

Transcription factor of the day

It’s handy to be clear about these basics before we turn to an exciting paper by Sai Gourisankar, Gerald Crabtree and colleagues from Stanford University and the MD Anderson Cancer Center, Houston entitled “Rewiring Cancer Drivers”. They focussed on a transcription factor called B-cell lymphoma-6 (BCL6) that plays an important role in the formation of lymphoid tissues and the production of antibodies. BCL6 normally acts as a repressor — it turns genes off. However, as you’ll guess from its name, BCL6 commonly undergoes mutations in various lymphomas, specifically forms of B-cell non-Hodgkin lymphoma.

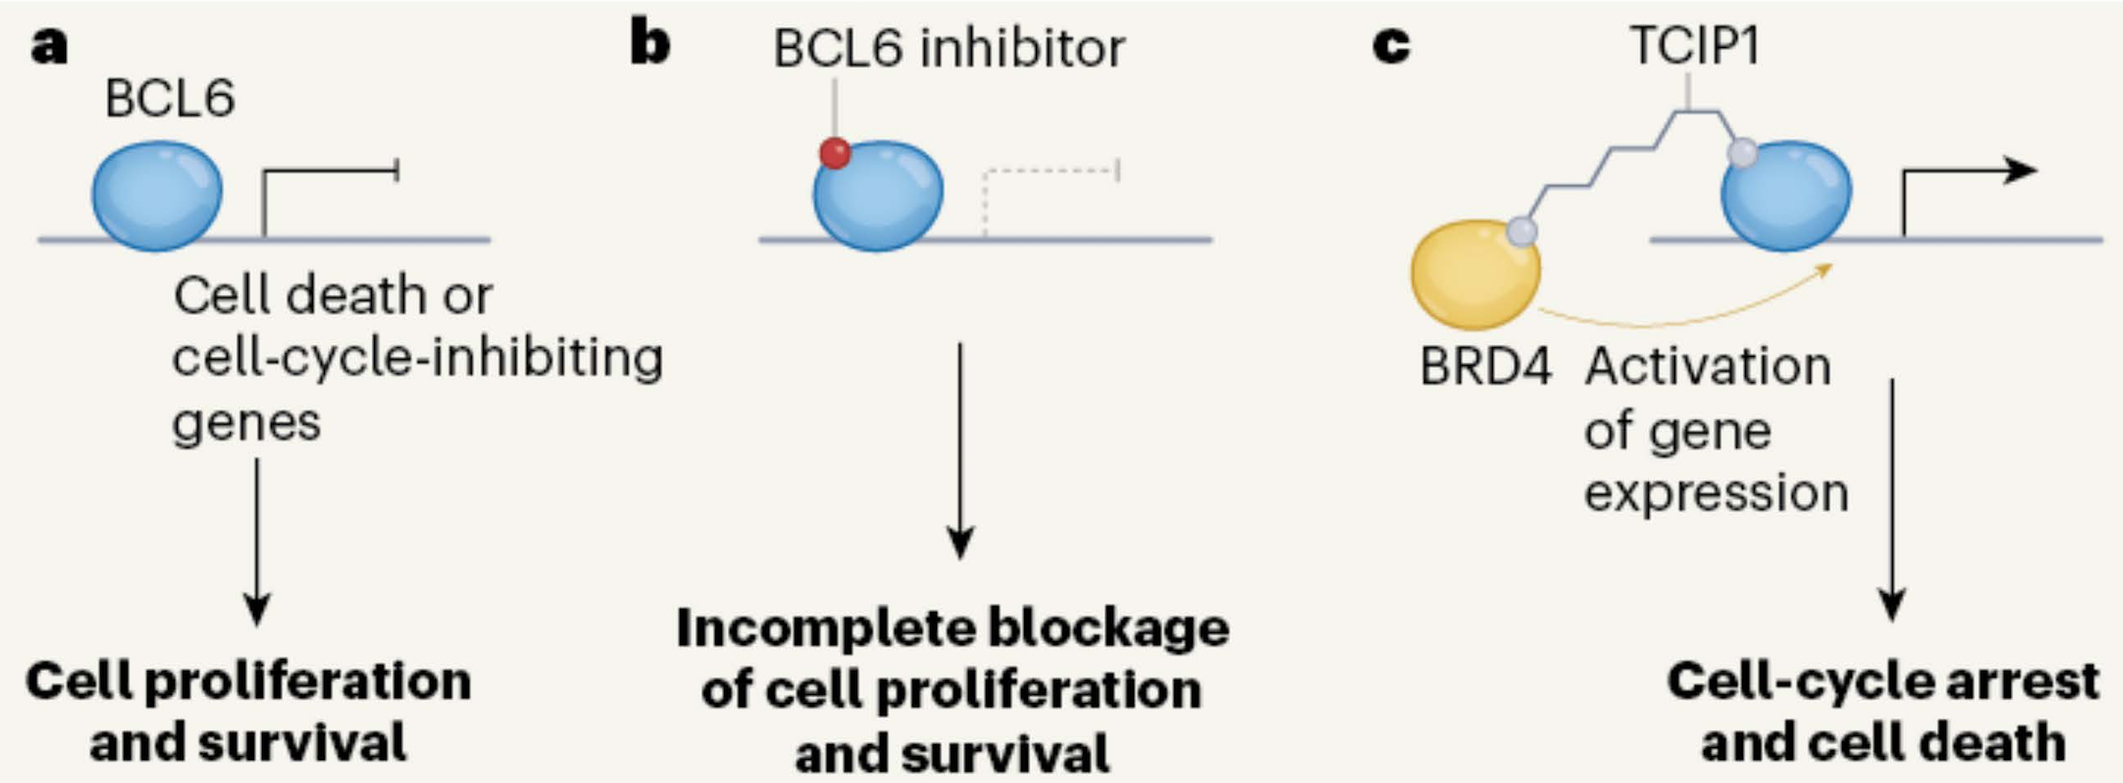
Engineering a transcription factor. a. BCL6 is a transcription factor that, in B cells, normally turns off genes encoding cell cycle inhibitors, thereby allowing some cancer cells to proliferate.  b. Small molecule inhibitors of BCL6 have shown some activity as anti-cancer agents.  c. Chemical coupling of TCIP1to BCL6 recruits BRD4, a transcription activator. This gives strong activation of genes normally turned off by BCL6 and kills cancer cells expressing BCL6. From Phelan and Staudt, 2023.

Why it’s exciting

Scheme c above shows Gourisankar & Co’s clever idea. They coupled BCL6 to a small molecule called TCIP1 (if you’re really interested this stands for transcriptional/epigenetic chemical inducer of proximity). TCIP1 binds to the protein BRD4 (bromodomain-containing protein 4) — a transcriptional and epigenetic regulator that plays a critical role in embryogenesis and cancer development. This juxtaposes BRD4 and BCL6, the upshot being that BRD4 potently activates the expression of genes normally silenced by BCL6.

Great chemistry — so what?

TCIP1 is an extremely potent killer of diffuse large B cell lymphoma cells that express BCL6. Thus the approach of using TCIP1 offers a new therapeutic strategy for these cancers. However, it may also be effective against other cancer types and there is good reason for optimism because there was a bonus in this paper in that TCIP1 also downregulates MYC — a master regulator that is abnormally expressed in many cancers. It’s not clear how this works as BRD4 is generally considered to drive cancers by activating MYC — so the mechanism is indirect but nontheless welcome for that!

And the down-side?

The flip side is that BCL6 suppresses inflammation in immune cells (knocking out BCL6 kills mice via an inflammatory reaction) which might be a problem for a treatment that targets this transcription factor. However, the authors looked hard in both normal mice and in human cells (fibroblasts) for evidence of tissue damage and found none, even though there were large changes in gene expression in spleen and lymphocyte cells.

Clearly there is much to learn about this approach of using what is in effect a double-headed molecule as an anti-cancer agent. The name of the Roman god of beginnings and endings has already been nicked by molecular biologists for the JAK kinases (their two faces link cytokine receptors to other proteins). Let us therefore avoid giving a trendy name to this new approach using TCIP1 but perhaps just nod to Janus in the hope that it will become a useful anti-cancer strategy.

References

Phelan JD, Staudt LM. Double-headed molecule activates cell-death pathways in cancer cells. Nature. 2023 Aug;620(7973):285-286. doi: 10.1038/d41586-023-02213-4. PMID: 37495782.

Gourisankar S, Krokhotin A, Ji W, Liu X, Chang CY, Kim SH, Li Z, Wenderski W, Simanauskaite JM, Yang H, Vogel H, Zhang T, Green MR, Gray NS, Crabtree GR. Rewiring cancer drivers to activate apoptosis. Nature. 2023 Aug;620(7973):417-425. doi: 10.1038/s41586-023-06348-2. Epub 2023 Jul 26. Erratum in: Nature. 2023 Sep;621(7977):E27. PMID: 37495688.

A Moving Picture

In the previous blog we caught up with the ongoing lung TRACERx study, specifically its work on the effect of air-born pollutants. However, TRACERx has a much broader overall aim, namely to follow the evolution of human lung cancers over time — tracking patterns of cell lineages (clones) of tumour cells, monitoring gene expression, tracking circulating tumour DNA (ctDNA) in the bloodstream and defining how immune cells target lung cancer (see figure below).

It’s important because lung cancer is the leading global cause of cancer-related deaths. The  two subtypes are non-small cell lung cancer (NSCLC: 85% of cases), and small cell lung cancer (the remaining 15%). NSCLC comes in three subtypes based on what the cells look like (lung adenocarcinoma, lung squamous cell carcinoma and large cell carcinoma).

The scale of these studies is hard to grasp for they examined NSCLC in 421 individuals and did genomic profiles of 1,644 tumour regions.

The moving picture of lung cancer. The scheme outlines the TRACERx project: tumour samples are analysed for patterns of cell lineages (clones) by comparing DNA and RNA sequences, for immune cells in the tumour microenvironment and for changes in tumour cells that have spread (metastasized) to distant sites. Circulating tumour DNA (ctDNA) shed into the bloodstream was also screened to monitor disease progression and response to treatment. From Hayes and Meyerson 2023.

The main aim

The central idea behind TRACERx is to map how the variables summarised above relate to clinical outcome — i.e. disease-free survival, the survival time after treatment without cancer symptoms. The approach is to get a view of the constantly changing picture of tumour heterogeneity by sequencing the protein-coding regions of known cancer driving genes (by whole-exome sequencing or by sequencing the whole-genome). This should reveal the effects of chemotherapy (e.g., platinum-based drugs).

In addition to the air-born pollutant work, the consortium has just published four more papers that reflect progress towards these aims. For the purposes of this blog we will attempt a brief summary of these — with sincere apologies to those whose fantastic work has thus been subsumed.

Jargon buster

First a note about the terminology of mutations in cancer:

(i) clonal mutations are shared by all cancer cells.

(ii) subclonal mutations are present only in a subset of tumour cells. A subclone is a descendant of the most recent common ancestor (MRCA) of the tumour sample.

(iii) truncal mutations are mutations present in the trunk of the cancer evolutionary tree, i.e. mutations present in all subclones and at all timepoints.

(iv) Whole-genome doubling (WGD) involves doubling of the entire chromosome complement. It is a prevalent event in cancer.

(v) A clonal sweep occurs when a subclone outcompetes its neighboring cells, resulting in a trend of reduced diversity and towards a homogeneous tumour.

Key points

1. Lung adenocarcinoma: Frankell et al. found sub-clonal mutations in 22 of 40 common ‘cancer genes’. These included TP53 and KRAS. Truncal mutations in TP53 and KRAS tended to be mutually exclusive and these were also exclusive for EGFR whole genome doubling (WGD). Amplification of MYC and activating mutations in receptor tyrosine kinase pathways (both major cancer drivers) were truncal events, in contrast to the generally subclonal events affecting TP53 and KRAS, despite the latter being major cancer drivers.

Subclonal WGD was detected in 19% of tumours and 10% of tumours had multiple subclonal WGDs. Subclonal, but not truncal, WGD was associated with shorter disease-free survival. Notably, 8% of these tumours in smokers showed no evidence of tobacco-induced mutations but they carried patterns of mutations in EGFR and other oncogenes (RET, ROS1, ALK and MET) resembling those found in never-smokers, suggesting similar causes.

In 1% of cases lung tumours were observed that had two distinct genomic origins. Called ‘collision tumours’ these consist of two distinct tumours that have grown to occupy the same region of the lung as a single, continuous mass.

Overall these results show the importance of clonal expansion, WGD and copy number instability in regulating the behaviour of non-small cell lung cancer.

2. Metastasis: Al Bakir et al. compared the genomes (DNA sequences) of primary tumours with those of their metastases and found that in 25% of cases metastatic growth diverged early, before the final clonal sweep in the primary. This shows up as a set of mutations in all regions of the primary that was absent from metastases. Early divergence often occurred in small tumours (less than 8 mm diameter) and was more common in smokers. All of which highlights the current limitations of radiological screening for identifying early diverging tumours and the problems of targeting metastasis-seeding subclones.

3. Metastasis: Abbosh et al. developed a bioinformatics method (ECLIPSE) to track low levels of ctDNA and thus identify cases of polyclonal metastatic dissemination that are associated with poor outcome. They also showed that ctDNA could forecast impending relapse and that it is useful for selecting patients who might benefit from drug treatments.

4. Intra-tumour heterogeneity: Martínez-Ruiz et al. looked at gene expression (i.e. the RNA molecules being made {transcribed} at any time) in non-small cell lung tumours and found that the outgrowth of a clone containing a specific mutation was positively selected when that gene was highly expressed. In addition they looked at different versions (alleles) of the same gene and found that both copy-number-dependent and copy-number-independent events could affect the expression of an allele (gene copy number means the number of copies of a given gene in an organism’s complete set of genes).

It emerged that copy-number-independent events affected epigenetic regulators (i.e. DNA and histone modulators). In particular mutations in a set of epigenetic modifiers (CREBBP, KDM5C, SMARCA4, SETD2 and KMT2B) were associated with increased levels of copy-number-independent alleles. By contrast, mutations in the de-methylase KDM6A were associated with decreased expression of these alleles.

These summaries do no justice at all to the huge amount of work that has produced these papers. Far from answering all the problems of lung cancer, they rather highlight our ignorance — but the advances they make on a range of fronts show that the enigma of lung cancer is slowly being prized open.

References

Hayes TK, Meyerson M. Molecular portraits of lung cancer evolution. Nature. 2023 Apr;616(7957):435-436. doi: 10.1038/d41586-023-00934-0. PMID: 37045956.

Frankell, A.M., Dietzen, M., Al Bakir, M. et al. The evolution of lung cancer and impact of subclonal selection in TRACERx. Nature 616, 525–533 (2023). https://doi.org/10.1038/s41586-023-05783-5

Al Bakir, M., Huebner, A., Martínez-Ruiz, C. et al. The evolution of non-small cell lung cancer metastases in TRACERx. Nature 616, 534–542 (2023). https://doi.org/10.1038/s41586-023-05729-x

Abbosh, C., Frankell, A.M., Harrison, T. et al. Tracking early lung cancer metastatic dissemination in TRACERx using ctDNA. Nature 616, 553–562 (2023). https://doi.org/10.1038/s41586-023-05776-4

Martínez-Ruiz, C., Black, J.R.M., Puttick, C. et al. Genomic–transcriptomic evolution in lung cancer and metastasis. Nature 616, 543–552 (2023). https://doi.org/10.1038/s41586-023-05706-4

Mapping the bug army

Followers of these pages will know that over the last decade our picture of solid tumours has gradually resolved into an ecosystem comprising a wide variety of cells, including numerous different types of immune cell, blood vessels and the extracellular matrix. In addition tumour-associated microbiota — microorganisms, predominantly bacteria — have emerged as an intrinsic part of the ‘tumour microenvironment’ in many cancer types.

The story so far

In the human gut there are about 2,000 different species of bacteria that, together, carry many hundreds more genes than the 20,000 encoded in the human genome. We’ve seen that that obesity causes a switch in the proportions of two major sub-families of bacteria, resulting in a decrease in the number of bug genes (it’s a small world). Even more remarkably, there’s evidence that the microbiome can affect metastasis (Hitchhiker Or Driver?).

Drawing the map

Now, in a really ambitious effort, Jorge Luis Galeano Niño, Susan Bullman and colleagues from the Fred Hutchinson Cancer Center, Seattle and other US centres have applied in situ spatial-profiling technologies and single-cell RNA sequencing to two types of human tumours. The idea was to map the presence of bacteria across the tumours. They used 77 antibodies to detect protein markers of particular cell types and major cancer-associated signalling pathways. On top of that they developed a single-cell RNA transcript profiling method that sequences human transcripts alongside bacterial rDNA transcripts in the same cell.

What did they find?

As ever, that bald summary does no justice to the technical brilliance involved but, as ever, what we’re really interested in are the results. A key finding was that Fusobacterium nucleatum is one of the most abundant types of bacterium in oral squamous cell carcinoma and colorectal cancer, consistent with previous work (Hitchhiker Or Driver?). Proteins associated with immunosuppression (PD-1 and CTLA4), were highly expressed in bacteria-rich areas of tumours, whereas hallmarks of cell proliferation (Ki67), were depleted, a further indication of a reduced immune response. This indicates what has been called a ‘proliferation–migration trade-off’ in which there is increased expression of genes associated with cell migration but inhibition of proliferation-associated and DNA repair genes.

Notably, bacteria were more common in tumour cells with an abnormal, rather than a normal, number of chromosomes, suggesting a bacterial preference for cancer cells over normal cells.

Finally, and very excitingly, colorectal cancer cells grown in a 3D system in the lab had an increased migration capacity when infected with Fusobacterium.

Features of bacteria in a tumour. Regions low in bacteria were associated with the presence of more blood vessels, and had high levels of T cells  and low levels of myeloid cells. Cancer cells in these regions had higher levels of proliferation. For regions with high bacterial levels (inside tumour and myeloid cells) myeloid cells were more common and T cells were rare and showed signs of immunosuppression — expression of the proteins PD-1 and CTLA4. Cancer cells in such regions also had a higher capacity for migration. From Livyatan and Straussman, 2022.

Bacteria stick to and enter oral squamous cell carcinoma tumour cells. Confocal images of bacteria-associated single cells after tissue dissociation. From Niño et al., 2022.

The spatial distribution of intra-tumoral bacteria in human tumours. The pixels are total bacterial reads: red = highest level. Left: oral squamous cell carcinoma. Right: colorectal cancer. From Niño et al., 2022.

Niño et al. mapped the 10 most common species in the two types of tumour. These varied between tumours and only Fusobacterium was present in  a significant fraction of both tumours. Moreover, the distribution of microbiota within a tumour is not random (see image above) but is highly organised in microniches together with host cells that promote aggression.

Fusobacterium and colorectal cancer. (A) Fusobacterium reprograms cancer cells during tumour progression, metastasis, and chemoresistance. (B) Fusobacterium reprograms the tumour microenvironment. From Wang et al., 2021.

The details of how F. nucleatum exerts its effects are still far from clear but there are some pointers. FadA and Fap2 permit bacteria to stick to cells and LPS regulates the inflammation signal through the innate immune pathway.

For the moment we should salute a technical tour de force that is not perfect in design nor complete in its answers but gives us the clearest picture yet of the complexity of the tumour microenvironment and the astonishing effects that can be wrought by our tiny co-dwellers.

References

Galeano Niño, J.L., Wu, H., LaCourse, K.D. et al. Effect of the intratumoral microbiota on spatial and cellular heterogeneity in cancer. Nature (2022). https://doi.org/10.1038/s41586-022-05435-0.

Livyatan, I. and Ravid Straussman, R. (2022). A spatial perspective on bacteria in tumours. Nature 16 November 2022. https://doi.org/10.1038/d41586-022-03669-6.

Wang S, Liu Y, Li J, Zhao L, Yan W, Lin B, Guo X and Wei Y (2021). Fusobacterium nucleatum Acts as a Pro-carcinogenic Bacterium in Colorectal Cancer: From Association to Causality. Front. Cell Dev. Biol. 9:710165. doi: 10.3389/fcell.2021.710165.

Intelligence: Of Birds, Men and Machines

About six years ago an eye-catching paper appeared showing that pigeons were remarkably good at identifying disease in humans on the basis of stained tissues presented on microscope slides or medical images (e.g., X-rays). In other words they could make a pretty good fist of the task that confronts pathologists and radiologists on a daily basis — and immense the task is if you think about the number of tissue samples that are assessed every day around the world and of the consequences that might follow an incorrect classification.

The evidence that pigeons might be quite good at this sort of pattern recognition came from Richard Levenson and colleagues from the University of California, the University of Iowa and Emory University. The idea was, in principle, simple: confront the birds with images and teach them to tap the correct colour band by giving them food when they got it right – i.e. distinguished diseased from normal samples.

Bird brain’s office. The pigeons’ chamber has a food pellet dispenser and a touch-sensitive screen. The medical image (centre) is flanked by choice buttons (blue and yellow rectangles for benign or malignant sample) activated by pecking. From Levenson et al., 2015.

Benign versus malignant. The images are slices of breast tumours stained with a dye. Top row: benign; Bottom row: malignant. Confronted with these pictures pigeons first performed with chance levels of accuracy but they quickly learned to discriminate. From Levenson et al., 2015.

The images above illustrate the challenge faced by pathologists. Radiologists attempting to decipher X-ray and CT images face similar difficulties. Astonishingly, Levenson et al. were able to train pigeons to a high standard of discrimination. It remains unlikely that white-coated avians will be seen any time soon fluttering along the corridors of our hospitals but it does raise the notion that, if pigeons are so smart, maybe we can harness artificial intelligence to help with the problem of screening tissues.

The science of artificial intelligence began in 1956 and in Taking Aim at Cancer’s Heart we described the saga that led to an IBM computer beating the then world chess champion — an example of machine learning whereby a sequence of instructions (an algorithm) defined the patterns that could be formed by the pieces on the chequerboard, enabling a computer to outpace the human brain. In that blog we described the application of pattern recognition to mutations in cancer that enabled future genetic changes to be predicted and hence how cancers will evolve.

Applying artificial intelligence …

Much commercial effort is now going into automated, artificial intelligence-based, ‘smart workflows’ to support radiographers in the use of every major imaging modality – MR, CT, ultrasound and X-ray. These too use machine learning — a set of instructions that focusses on recognizing data patterns. Training data sets comprise examples denoted as ‘cancer’ or ‘not cancer’. When presented with a new image the algorithm works out which group it falls into.

To lung cancer

A number of AI projects are focussed on lung cancer because its early symptoms are often ignored and by the time it is diagnosed treatments are relatively ineffective. However, there’s also a practical reason in that lung tumours have a much greater difference in radio density relative to air than any other organ. The technique of X-ray computed tomography (CT) was developed by Sir Godfrey Hounsfield and Allan Cormack and the Hounsfield Unit (HU) is a quantitative scale for measuring radiodensity. The figure for air is about 1000 HU: for a solid lung tumour lump the range is 20-100 HU.

Diego Ardila and colleagues at Google AI, Mountain View, California trained their system using a database of more than 40,000 CT scans  (Ardila et al. 2019). These included both patients with lung cancer and individuals who had not been diagnosed with the disease. They instructed the computer which early-stage scans turned out to contain cancerous spots and which did not. With time the computer gradually improved in being able to discern malignant spots from benign ones. Eventually their system correctly identified the early stages of lung cancer 94% of the time and out-performed a group of experienced radiologists.

In the UK the TRACERx (TRAcking Cancer Evolution through therapy (Rx)) lung study is a nine-year, multi-million pound research project run by the Institute of Cancer Research, London. A key aim is to look at what is going on within the tumour (intratumour heterogeneity) and how that relates to clinical outcome. It’s also examining the impact of treatment regimens. Khalid AbdulJabbar, Charles Swanton, Yinyin Yuan and colleagues recently reported that, after training the computer on hundreds of images of early stage lung tumours, the system acquired the capacity to select tumours with regions low in immune cells. It emerged that these are more likely to relapse after surgery to remove tumour tissue or drug treatment (chemotherapy). The capacity to acquire this sort of information in the early stages of lung cancer has important implications for treatment and in particular for guiding immunotherapy.

To breast cancer

DenSeeMammo is a fully automated software system design to tackle the problem of breast density in mammography screening. The density of breast tissue is variable — it’s dense if there’s a lot of fibrous or glandular tissue and not much fat — and it poses a problem in detecting abnormal growths. Fiona Gilbert, Olivera Djuric and colleagues from the University of Cambridge and a number of other European institutes have now developed this platform to the point where it can equal the performance of radiologists in predicting breast cancer risk. They showed this in an analysis of more than 14,000 2D mammograms from several European studies. Even more excitingly, this automated system performed even better in predicting interval cancers (these are cancers diagnosed after a negative mammogram but before the next mammogram screen). These results suggest that DenSeeMammo and ongoing improvements in automated screening will become a significant aid to radiologists in assessing mammographic images.

To cancers of unknown origin

Other recent studies show how this field is progressing across the spectrum of cancer diagnosis. Ming Lu, Faisal Mahmood and colleagues at Harvard devised the appealingly named TOAD (Tumour Origin Assessment via Deep Learning), a deep-learning-based algorithm that could identify the origin of primary tumours. This is important because knowing the site of a primary tumour is important in guiding the treatment of metastatic tumours and, despite advances in tissue testing, about 2% of cancers cannot be categorised in terms of their origin.

Much like the pigeon studies, they used whole-slide images of tumours with known primary origins to ‘train’ a computer model to distinguish primary from metastatic tumours and to predicts sites of origin. The basic idea is to segment the area of the slide into tens of thousands of regions — small patches. Computers digitize the information for analysis — it’s virtual microscopy and the method is now called digital pathology.

TOAD is a multiple-instance learning algorithm — a variation of supervised learning in which the model ‘learns’ from a training dataset — much as we do under the guidance of a teacher. It’s is a subcategory of machine learning and artificial intelligence. TOAD learns to rank all of the regions of the tissue in the slide and to combine this information across the whole slide. From this complex analysis TOAD can predict both the tumour origin and whether the cancer is primary or metastatic. In addition TOAD has predictive capacity as to how the cancer may develop.

The performance of a machine learning model can be checked using an ROC (Receiver Operator Characteristic) curve and measuring the area under the curve (AUC). In general, an AUC of 0.5 suggests no discrimination, 0.7 to 0.8 is considered acceptable, 0.8 to 0.9 is considered excellent, and more than 0.9 is considered outstanding. For distinguishing primary from metastatic tumours TOAD achieved AUC-ROC values greater than 0.95. Similar levels of performance were obtained in identifying sites of origin.

It’s worth emphasising that in the analysis of tissues the idea is not that computers will replace humans but that they will become able to sort samples in to positive, negative and unresolved. The enormously valuable upshot will be that expert human eyes can focus on the tricky ones and be spared the strain of dealing with those that are clear-cut.

And to sequence analysis

Similar approaches using biologically informed deep learning models have also been applied to DNA sequences from tumours. We noted one of these — REVOLVER — in Taking Aim at Cancer’s Heart. A recent example, P-NET, has been developed by Haitham Elmarakeby, Eliezer Van Allen and colleagues at the Al-Azhar University, Cairo, the Dana-Farber Cancer Institute, Boston, and the Broad Institute of MIT and Harvard. P-NET was used to stratify patients with prostate cancer. By analysing mutations in DNA and copy number variations in genes, P-NET can predict how primary prostate cancer will progress, in particular whether it will develop into castration-resistant prostate cancer. This is a form of advanced prostate cancer that is no longer fully responsive to treatments that lower testosterone.

Based on genomic profiles P-NET can predict the potential for recurrence and identify molecular drivers — i.e. critical mutations. As with TOAD, P-NET requires tuning and training before use. Specifically Elmarakeby’s group rediscovered known genes implicated in prostate cancer (AR (androgen receptor), PTEN, TP53 and RB1) but they also found novel candidate genes, e.g., MDM4 and FGFR1, implicated in advanced disease. MDM4 inhibits p53 and FGFR1 (Fibroblast Growth Factor Receptor 1) can promote tumour progression and metastasis. Their results suggest that MDM4-selective inhibitors may be effective in metastatic prostate cancers that retain a normal TP53 gene.

Thus, in addition to pattern recognition, methods based on machine-learning for the analysis of tumour DNA sequences can reveal both specific mutations and biological pathways, providing a powerful insight into the processes involved in cancer progression and guidance in translating these discoveries into therapeutic opportunities.

References

Levenson RM, Krupinski EA, Navarro VM, Wasserman EA (2015). Pigeons (Columba livia) as Trainable Observers of Pathology and Radiology Breast Cancer Images. PLoS ONE 10(11): e0141357.

Ardila, D., Kiraly, A.P., Bharadwaj, S. et al. (2019). End-to-end lung cancer screening with three-dimensional deep learning on low-dose chest computed tomography. Nat Med 25, 954–961.

AbdulJabbar, K., Raza S.E.A., Rosenthal, R., et al. (2020). Geospatial immune variability illuminates differential evolution of lung adenocarcinoma. Nat Med. 26(7):1054-1062.

Lu, M.Y., Chen, T.Y., Williamson, D.F.K. et al. (2021). AI-based pathology predicts origins for cancers of unknown primary. Nature 594, 106–110.

Elmarakeby, H.A., Hwang, J., Arafeh, R. et al. (2021). Biologically informed deep neural network for prostate cancer discovery. Nature.

Giorgi Rossi P, Djuric O, Hélin V, et al. (2021). Validation of a new fully automated software for 2D digital mammographic breast density evaluation in predicting breast cancer risk. Sci Rep. 2021;11(1):19884. doi:10.1038/s41598-021-99433-3.

Less On Top Of More

Many moons ago powdered wigs were all the rage — a fashion seemingly started by The Sun King, aka Louis XIV, who noticed he was going bald at the tender age of 17 and no doubt felt this might limit his sex appeal. Mind you, as syphilis is thought to have caused his hair failure, you might think that quite enough of a turn-off — though maybe not in the jolly old Court of Versailles.

Whatever, when Charles II followed the trend in England, it was wigs for all.

Shifting an itch

In fact there was some science behind the fad in that, back in the 17th century, head lice (nits as we might say) were a problem. When heads were shaved and wigs fitted the nits simply moved upstairs and could be dealt with on laundry day.

What’s new?

Wigs have come and gone but man’s hair anxiety remains — as judged by the number of hairy potions you can buy on line and the fact that the U.S. Food and Drug Administration has approved two drugs to treat male pattern baldness (i.e. a receding front hair line or a bald spot). You can even buy a baseball cap with built-in hair re-growth promoting lasers for £1200.

There’s nothing odd about hair loss — it happens all the time to the tune of up to 100 hairs a day — and pattern hair loss is also common, appearing (disappearing might be a better word) in about 50% of men and a quarter of women by age 50 — generally put down to genetics, age and male hormones. The technical term for hair thinning or balding is hair follicle miniaturization — meaning that the follicles, originally producers of healthy hairs, start making thinner hairs with a fragile shaft that can easily fall out. Thus hair loss arises from damage to or depletion of hair follicle stem cells (HFSCs).

Structure of normal skin. DermNet NZ.

So it’s an age-old problem — but now there’s a new player in the shape of obesity and the cumulative evidence that, by heightening the risk of a range of conditions (from diabetes to heart disease and cancers), excess weight can also lead to hair loss.

Even so, a direct link between the global epidemic of obesity and baldness has been lacking. Step forward Hironobu Morinaga, Emi Nishimura and colleagues from the University of Tokyo with some very convincing experiments that involved feeding mice a high-fat diet (HFD).

Tubby and bald

Spoiler alert! as they say these days: the HFD made the mice gain weight: obesity-induced stress then led to hair thinning. This is clearly visible in the photos below and the degree of hair loss did indeed correlate with increased body weight in HFD-fed mice. Note that this effect is entirely down to diet. Mouse fans may know that they (mice, that is — though we have it too) have a gene (TUB) that makes the tubby protein — and mice with a mutated tubby become obese and deaf, the latter because they lose hair cells.

Obesity accelerates hair loss in mice. Top: Mice fed for six months on a normal diet. Bottom: Mice fed for six months on a high fat diet. Note the bald patch. Morinaga et al. 2021.

Almost more dramatic than the mice going bald were the efforts of the group to track down what was happening at the cell and molecular level. The HFD caused epidermal  keratinization of HFSCs although it did not reduce their number. This means that in the outmost layer of skin the cell content (cytoplasm) is replaced by the fibrous protein keratin and the cells begin to die. It is clear from the images below that the HFD causes loss of normal cells (tagged red) and, after six months, the hair follicle cells are tending to resemble those in aged mice that are predominantly green (i.e. keratinized).

Obesity causes loss of hair follicle stem cells. Left: Mice fed for six months on a normal diet; Centre: High fat diet; Right: Old mice (22 months). Red marker: a protein (COL17A1) that regulates HFSC self-renewal and ageing; Green marker: Keratin 14, a marker for keratinocytes, the primary cell type of the epidermis. Arrows indicate follicles without a detectable HFSC-containing bulge. Morinaga et al. 2021.

They were also able to show that keeping mice on the HFD caused fat droplets to accumulate in HFSCs — much as was recently shown for immune cells (see Fatbergs Block Cancer Defences), a way by which obesity paralyses the immune response to tumours.

Mechanism of hair loss. Loss of hair follicle stem cells (blue dots) and increase in keratinized cells (red dots) leading to hair thinning/hair loss. Morinaga et al. 2021.

The upshot of fat build up in HFSCs is the blockade of a signalling pathway (called Sonic Hedgehog, controlled by a protein (SHH) that regulates embryonic development, not a turbocharged blue hedgehog). This block leads to elimination of fat-laden HFSCs — hair loss.

Keeping your hair on

All of this means that inflammatory signals that occur in obesity caused by a Western diet — i.e. a high fat diet including red meat, processed meat, pre-packaged foods, high-fat dairy products, etc. — can repress organ regeneration signals, one result being hair follicle miniaturization and baldness. For those with hair concerns we should note that activation of SHH in transgenic mice rescued HFD-induced hair loss and the same effect was produced by a drug that turns on the Sonic Hedgehog pathway Not an invitation to start gorging on burgers without worrying about going bald but an indication that we may ultimately be able to control these complex signalling pathways!

Reference

Morinaga, H., Mohri, Y., Grachtchouk, M. et al. (2021). Obesity accelerates hair thinning by stem cell-centric converging mechanisms. Nature 595, 266–271.